Fig. 3.
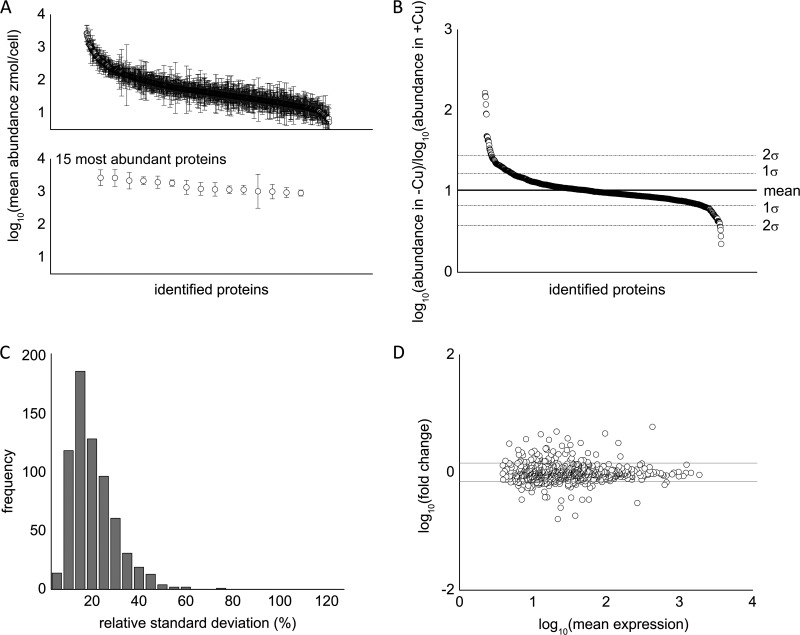
Statistical overview of reproducibility of the proteomics dataset. A, top: representative log10 ratio of protein abundance of metal-deficient cells versus metal-replete cells. Approximately 80% of identified proteins are within 1 standard deviation of the mean change in abundance. Bottom: the top 15 most abundant proteins were identified and are, from left to right, eukaryotic translation elongation factor 1 α 3 (Cre06.g263450), eukaryotic translation elongation factor 1 α 2 (132905), ribulose-1,5-bisphosphate carboxylase/oxygenase large subunit (41179049), isocitrate lyase (Cre06.g282800), fructose-1,6-bisphosphate aldolase (Cre05.g234550), S-adenosyl homocysteine hydrolase (Cre03.g204250), cobalamin-independent methionine synthase (Cre03.g180750), 2-cys peroxiredoxin (Cre06.g257601), glyceraldehyde-3-phosphate dehydrogenase (Cre01.g010900), enolase (Cre12.g513200), pre-apoplastocyanin (Cre03.g182551), ribulose-1,5-bisphosphate carboxylase/oxygenase small subunit (108283), oxygen-evolving enhancer protein 2 (Cre12.g550850), phosphoenolpyruvate carboxykinase (Cre02.g141400), and unnamed protein (Cre12.g528000). B, representative plot of the ratio of protein abundance between copper-deficient and copper-replete cells. Roughly 20% of the data lie outside 1 standard deviation, and only 5% of data lie outside 2 standard deviations. C, histogram of the relative standard deviation (RSD). The average %RSD was 18%. D, representative mean difference scatterplots after pooling biological replicates from metal-deficient and metal-replete conditions.

