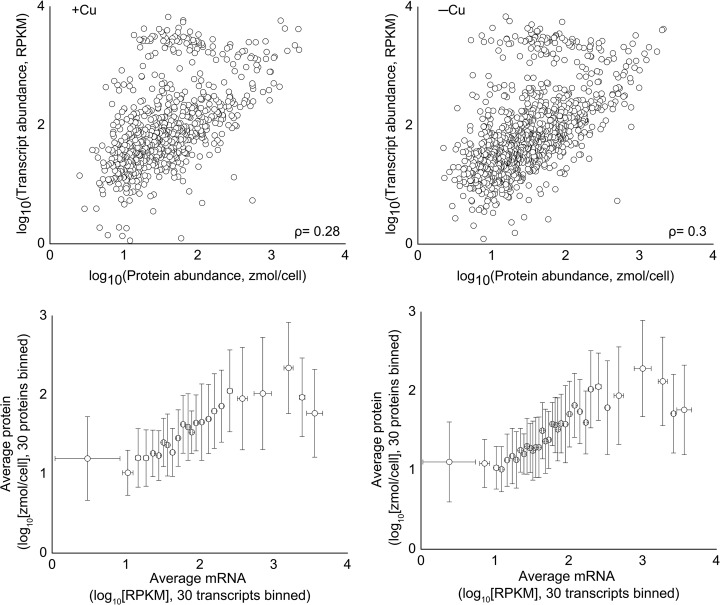
Fig. 6.
RNA and protein levels are moderately correlated under steady state conditions. (Top row) RNA and protein abundance were log transformed then compared via scatter plot. The Pearson correlation was also calculated for each dataset. (Bottom row) Data were sorted by RNA abundance and binned in groups of 30. For the +Cu data, R2 = 0.78, and for −Cu, R2 = 0.77.

