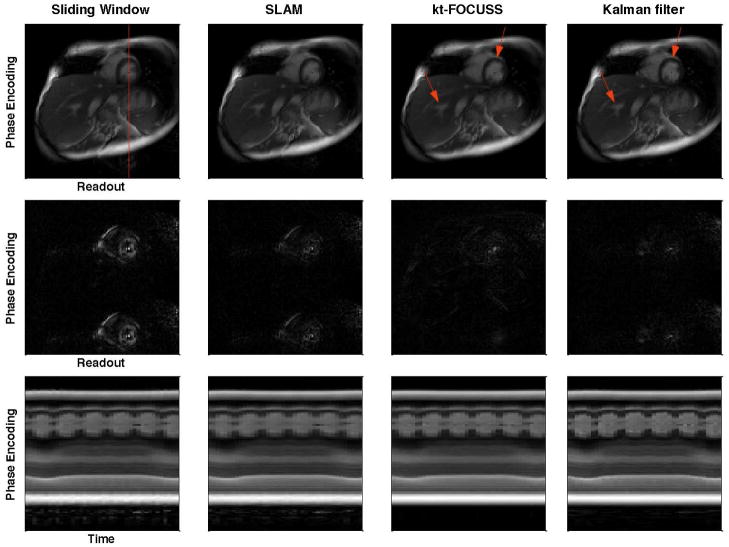
Figure 5.
Images reconstructed using sliding window, SLAM, kt-FOCUSS and Kalman filter methods with undersampling factor of 2 (top row), the corresponding difference images with the raw image (middle row) and the image intensities along the red vertical line (top left image) as a function of time (bottom row). Aliasing and temporal blurring are lowest for the Kalman filter method.

