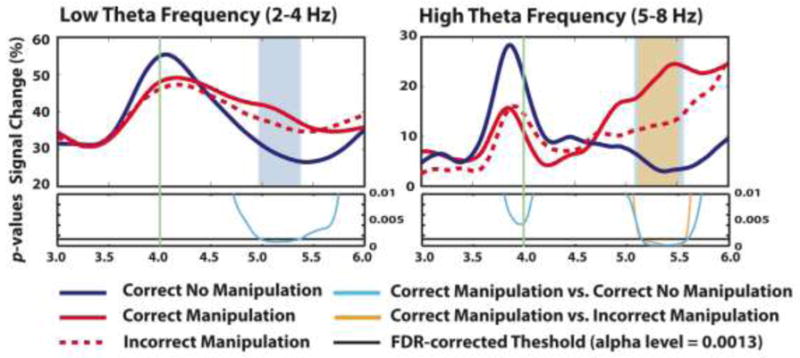
Figure 3.

Extracted percent signal change (%) at low theta (2–4Hz, left) and high theta frequency bands (5–8Hz, right) from the frontocentral channel (Fz) during delay period 2 for correct no manipulation (dark blue line), correct manipulation (red line) and incorrect manipulation (red dotted line). The vertical green line at 4000ms indicates the onset of the delay period 2. The bottom of each panel shows p-values from the statistical comparison between ‘correct manipulation and correct no manipulation’ (light blue line) and ‘correct manipulation and incorrect manipulation’ (orange line). The black horizontal line in the bottom panel indicates the FDR-corrected threshold at the alpha level of 0.0013 (p = 0.05 FDR-corrected). The blue and orange areas indicate significant windows for the ‘correct manipulation and correct no manipulation’ comparison and the ‘correct manipulation and incorrect manipulation’ comparison, respectively.
