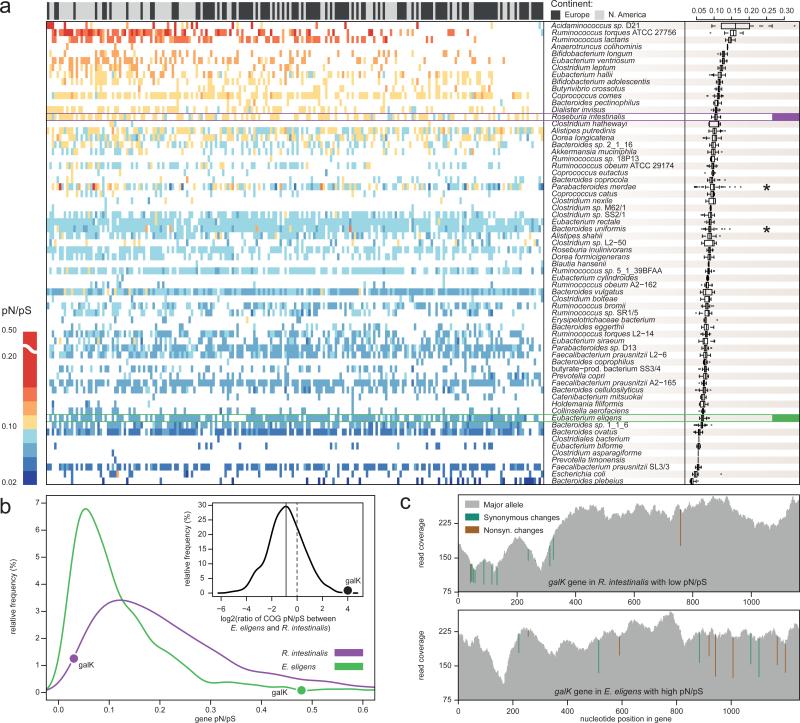
Figure 2. pN/pS ratios of 66 dominant species reveal more variation between species than between individuals.
a) A heatmap of pN/pS ratios for the 66 dominant species (rows) and 207 individuals (columns; only the first time-point per individual) is shown and summarized by species (boxplots on the right). Rows and columns are ordered by their mean pN/pS ratios, which vary considerably between species, but have a tighter bandwidth across samples. Two genomes that are exceptions to this trend (indicated by *) might indicate higher strain diversity. The panel above the heatmap indicates the continent of residence for each individual. A significant difference was found in the mean pN/pS ratios between the two continents, although this is likely an effect of lower sequencing depths of European samples (Supplementary Table 8) that leads to missing data points in some samples (see for example top right corner). b) The distributions of average pN/pS ratios of individual genes from Roseburia intestinalis and Eubacterium eligens (both highlighted in (a)) illustrate that, while base pair coverages are similar, the pN/pS ratio of R. intestinalis is higher in general. The relative pN/pS ratios of orthologous groups in the two species are shown in the inset, the average log2 ratio indicated by the solid line and the random expectation by the dashed line. Outliers can be revealed this way, like the galactokinase gene (galK) whose pN/pS is among the lowest in R. intestinalis and the highest in E. eligens. c) Illustration of low and high pN/pS ratios in galK genes from R. intestinalis (top panel) and E. eligens (bottom panel). The cumulative read coverage is shown in grey with synonymous (green) and non-synonymous (brown) changes marked at the nucleotide positions they occur.

