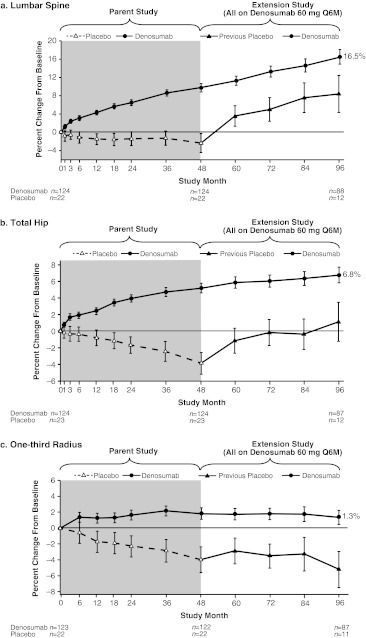
Fig. 2.
Effect of 8 years of continued denosumab treatment on BMD at the a lumbar spine, b total hip, and c one-third radius. BMD values are shown as percent change from parent study baseline (LSM + 95 % CI based on ANCOVA models adjusting for geographical location and parent study baseline BMD values). Gray boxes indicate the original 4-year parent study. Numbers shown at each time point reflect the number of subjects enrolled in the extension study with observed data at the selected time points of interest

