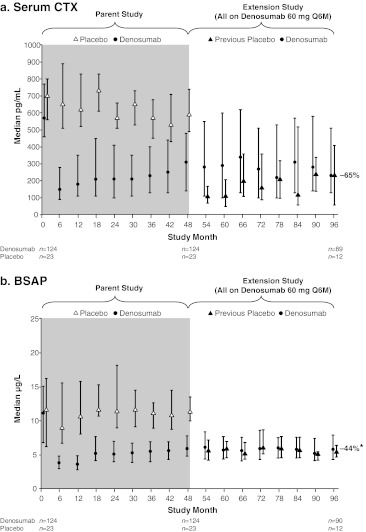
Fig. 3.
Effect of 8 years of continued denosumab treatment on levels of a serum CTX and b BSAP. Bone turnover markers are shown as actual values (medians with Q1 to Q3 interquartile ranges). Gray boxes indicate the original 4-year parent study. Numbers shown at each time point reflect the number of subjects enrolled in the extension study with observed data at the selected time points of interest. Asterisk A calibration discrepancy at the central laboratory may have led to BSAP results in some individual samples to be falsely elevated by up to 14 % at months 90 and 96

