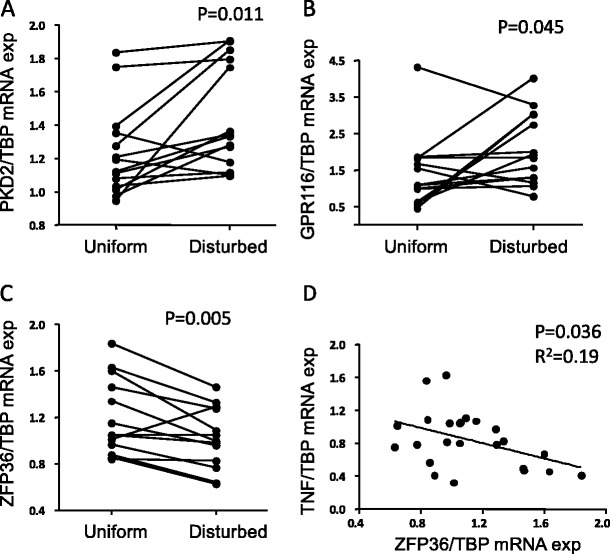
Fig. 3.

Expression of query and non-query genes in uniform and disturbed flow pattern regions of rat aorta. Shown are PKD2 (a), GPR116 (b) and ZFP36 (c) mRNA expression. d Correlation between ZFP36 and TNF mRNA expression (n = 26). Gene expression was analysed by quantitative real-time PCR and normalized to TBP mRNA expression
