
Fig. 7.
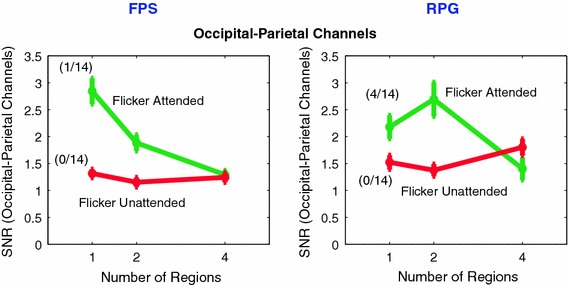
EEG results (20 Hz): The dependence of SNRa (flicker attended) and SNRu (flicker unattended) on the number of regions to be attended or ignored. SNRa and SNRu were averaged across occipital-parietal electrodes, shown in blue in Fig. 3 (3rd row, 20 Hz). Both groups of gamers exhibit similar trends at 20 Hz, SNRa decreases with increasing number of regions while SNRu does not show any significant monotonic trend (Color figure online)