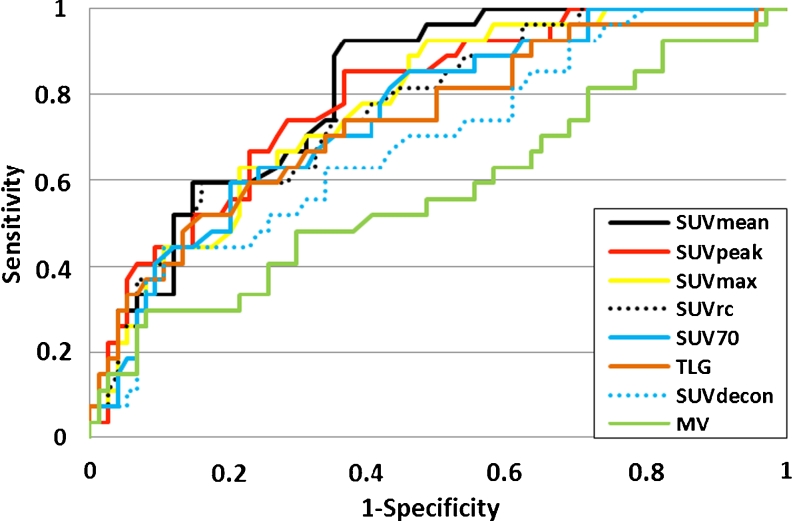
Fig. 3.
ROC curves for the SUVmean, SUVpeak, SUVmax, SUV70, SUVrc, SUVdecon and MV indices calculated from PET/CT scans performed on day 14 of therapy for the identification of responding (n = 27) and nonresponding (n = 74) lesions as defined by the RECIST 1.0 classification 6 to 8 weeks after treatment

