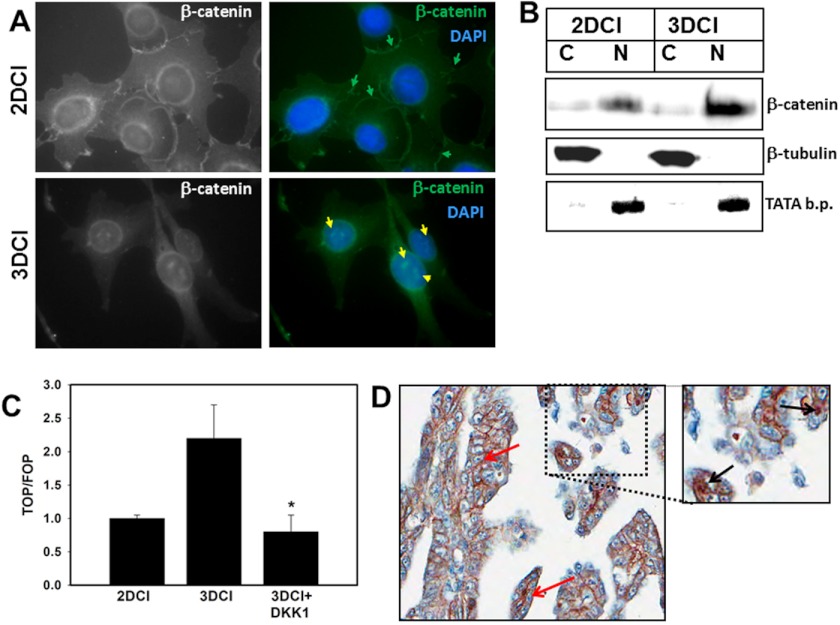
FIGURE 4.
Three-dimensional CI modulates β-catenin dynamics. A, DOV13 cells were cultured for 6 h on three-dimensional (3D) CI or planar collagen (two-dimensional (2D)) as indicated followed by fixation and staining using anti-β-catenin and anti-mouse Alexa Fluor 488 antibodies at 1:50 and 1:500 dilutions, respectively. Nuclei are stained with 4′,6-diamidino-2-phenylindole dihydrochloride (DAPI). Immunofluorescence images were taken with a Zeiss Axiovert fluorescence microscope using a 63× objective. Green and yellow arrows show membranous and nuclear β-catenin, respectively. Nuclear β-catenin was detected in >70% of cells cultured on three-dimensional CI (evaluation of 100 cells per condition). Magnification, 400×. B, cells were cultured on three-dimensional CI or planar collagen I for 6 h and subjected to subcellular fractionation as indicated under “Experimental Procedures” to collect cytoplasmic (C) and nuclear (N) fractions. The lysates were analyzed by Western blot using anti-β-catenin at a 1:50 dilution, anti-β-tubulin at a 1:1000 dilution, and anti-histone H3 at a 1:50 dilution. β-Tubulin and TATA-binding protein (b.p.) expression served as indicators of successful separation of cytoplasmic or nuclear protein fractions, respectively. To provide semiquantitative analysis of β-catenin distribution, levels of nuclear β-catenin were quantified using densitometry and normalized relative to TATA-binding protein. A 2-fold increase in nuclear β-catenin was observed in cells cultured on three-dimensional CI relative to two-dimensional. C, cells were transiently transfected with TOPFlash (TOP) and FOPFlash (FOP) promoter-luciferase reporter constructs to evaluate β-catenin transcriptional activity in cells cultured on three-dimensional CI versus planar (two-dimensional) collagen I for 6 h. A Renilla luciferase-expressing plasmid was co-transfected to account for the efficiency of transfection. Cells were lysed, and the luciferase signal was measured using a Dual-Luciferase system. TOPFlash and FOPFlash signals were first normalized to the Renilla luciferase signal, and then ratios of TOPFlash to FOPFlash were calculated. Results represent the mean and S.D. of three experiments. * designates p < 0.05 relative to control cells on three-dimensional CI. D, immunohistochemical analysis of β-catenin expression in metastatic human ovarian carcinoma. Shown is a specimen of a metastatic serous papillary adenocarcinoma from ovary to omentum (core number 43 in OV808 tissue microarray, US Biomax). Pictures were taken with an Aperio Imagescope system at 20× magnification. The outlined region was magnified 1.5-fold. Red arrows indicate membranous and black arrows indicate nuclear β-catenin.

