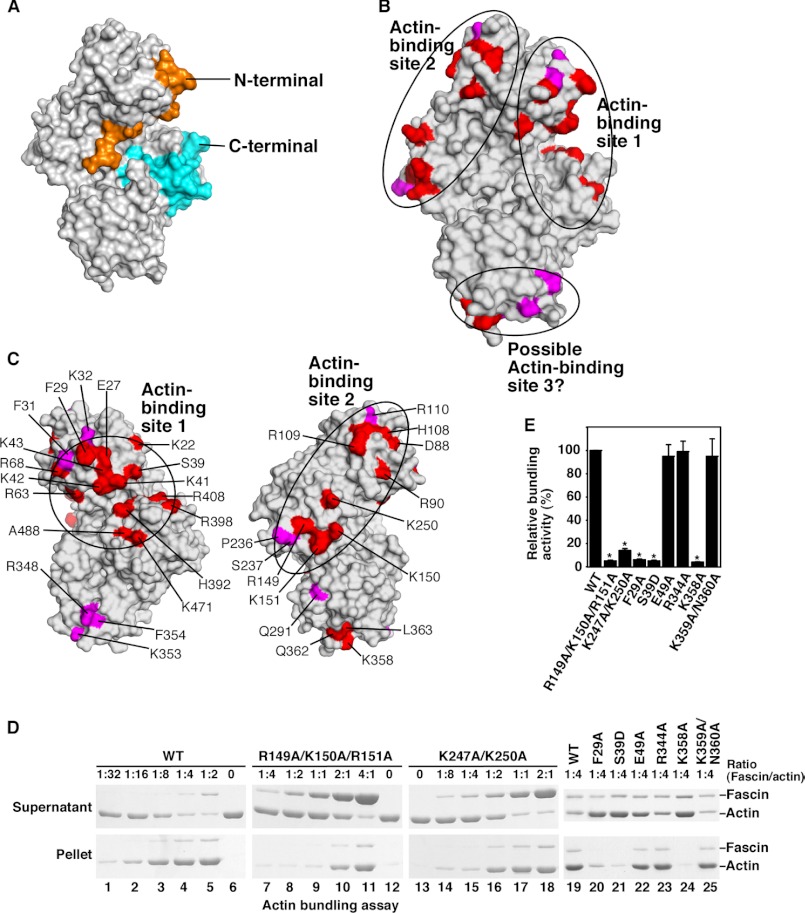
FIGURE 1.
Identification of two major actin-binding sites on fascin. A, surface presentation of the structure of fascin. The N and C termini were labeled in orange and blue, respectively. B and C, surface presentation of the fascin structure showing the two major actin-binding sites identified from systematic mutagenesis studies. Critical residues involved in actin bundling are indicated. D, low-speed centrifugation assays of the actin-bundling activity of fascin and its representative mutants. G-actin (1 μm) and different concentrations of fascin or fascin mutant proteins were used. E, quantification of the data from low-speed centrifugation assays (ratio of fascin/actin as 1:4). Results are mean ± S.D. (n = 3, *, p < 0.001). Residues showing strong effects (>80% decrease in the actin-bundling activity) are labeled in red. Residues showing moderate effects (>50 but <80% decreases) are labeled in magenta.

