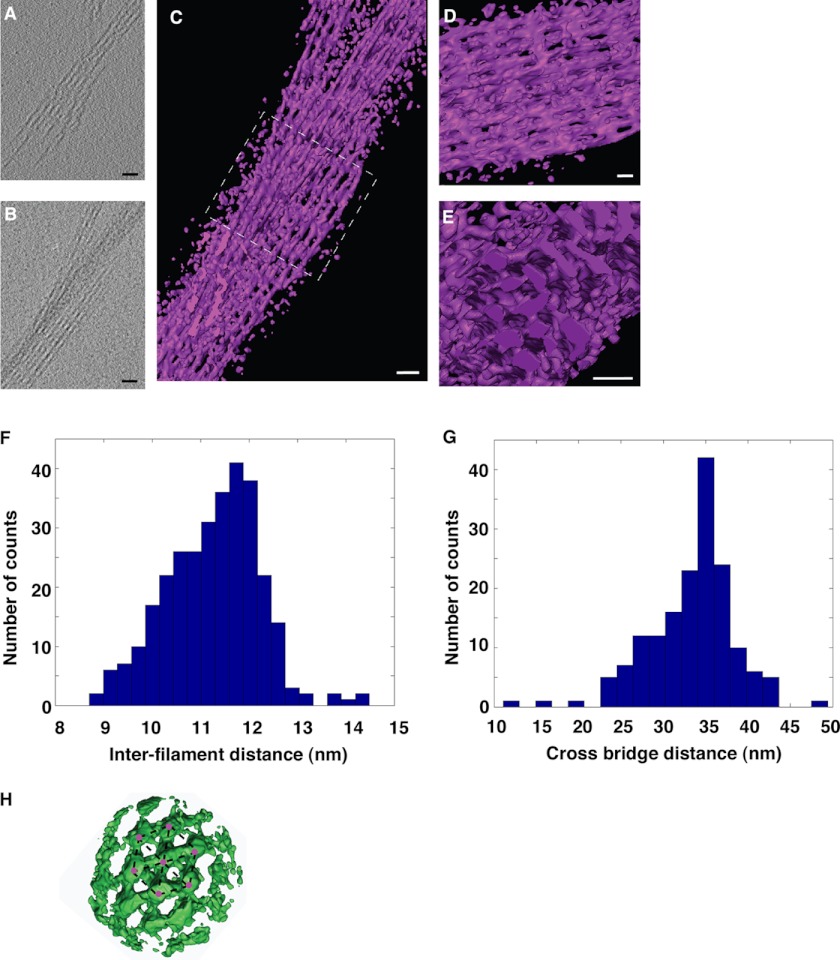
FIGURE 4.
Cryo-electron tomography of in vitro reconstituted F-actin and fascin bundles. A, a 4.4-Å thick slice (XY plane) from a tomogram containing a bundle of filaments. B, projection along the Z axis of the same tomogram. The total thickness of this tomogram was 110 nm. The entire tomogram was used for the Z-projection. C, three-dimensional rendering of the bundle where filaments and periodic connections between them are visible. D, zoom in and slightly rotated view of the area inside the dashed square in C. E, orthogonal view with respect to the one in D, showing actin filaments arranged in a hexagonal packing. Scale bar in all the images is 30 nm. F, histogram of inter-filament distances. The average is 11.2 ± 0.9 nm (mean ± S.D.; number of measurements = 308). G, histogram of distances between cross-bridges. The average is 33.3 ± 5.1 nm (mean ± S.D.; number of measurements = 166). H, surface rendering front view of the average electronic density obtained by subtomogram averaging. 147 boxes containing filaments and cross-bridges were manually picked, extracted from the tomograms, and iteratively aligned and averaged. Up to 10 actin filaments with several cross-bridges between them can be distinguished clearly. The hexagonal packing of the filaments (red dots) is also visible (indicated by dashed lines). Scale bar is 30 nm.

