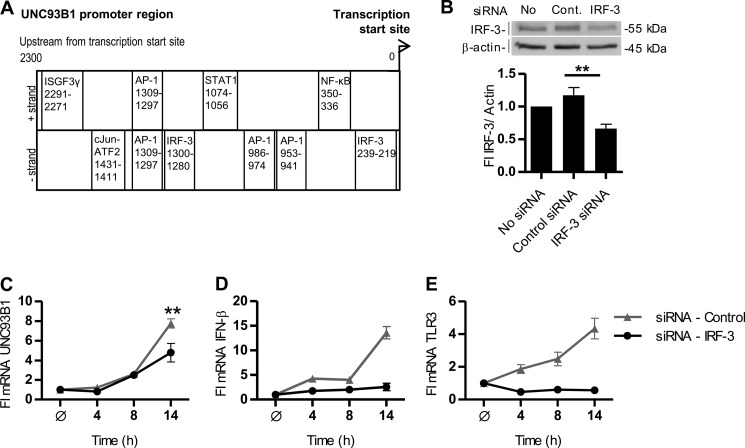
FIGURE 2.
Transcriptional regulation of UNC93B1. A, shown is a schematic map of the 2300 bp of the human UNC93B1 promoter region. TFBS for transcriptional factors promoting antiviral response are distributed according to the distance from the transcription start site. B–E, HUVEC cells were transfected with an siRNA pool specific to human IRF-3 or negative control siRNA non-target pool. B, HUVEC cells were lysed and subjected to Western blot. IRF-3 was detected with anti-IRF-3 antibodies. Anti-β-actin antibodies were used as a loading control. IRF-3 expression was normalized to the loading control and calculated as a percentage of the intensity of the untreated control. Densitometric analysis is shown below the blot. This experiment was repeated twice, and the representative data are shown. Statistical significance is indicated by **, p ≤ 0.05. C–E, the effect of IRF-3 knockdown on transcription of UNC93B1, IFN-β, and TLR3 is shown. 48 h after siRNA transfection cells were treated with poly(I:C) (25 μg/ml) for 4–21 h or left untreated. Induction of UNC93B1 (C), IFN-β (D), and TLR3 (E) mRNA was subsequently measured by real-time PCR. The results are represented by mean values with S.D. from the triplicate wells showing the representative data from three experiments. Statistical significance is indicated by **, p ≤ 0.05.

