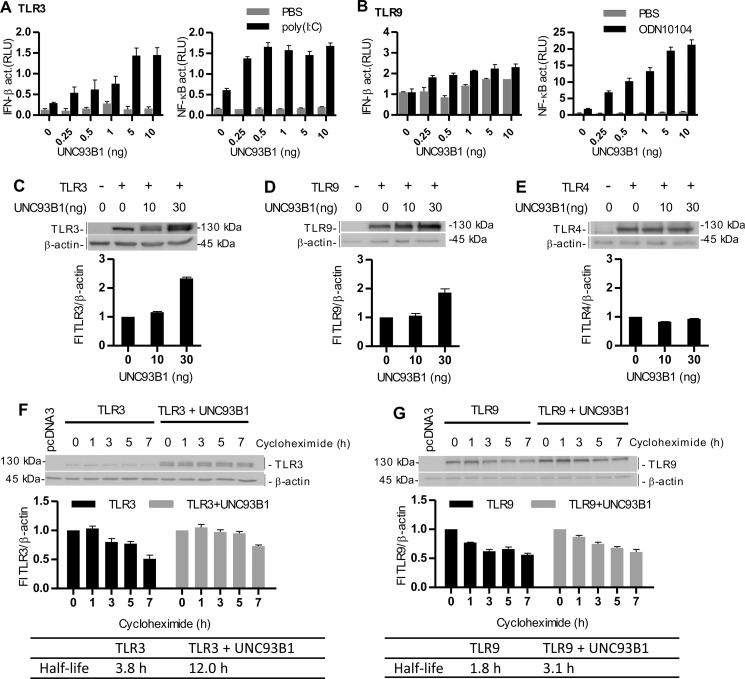
FIGURE 5.
UNC93B1 augments signaling and protein lifetime of TLR3 and TLR9. A and B, HEK293 cells were transfected with plasmid encoding TLR3 (A) or TLR9 (B) with increasing amounts of UNC93B1. Cells were cotransfected with IFN-β- or NF-κB-responsive reporter plasmids and Renilla normalization reporter plasmid. 18 h after stimulation with poly(I:C) (10 μg/ml) (A) or ODN10104 (10 μg/ml) (B), luciferase activity (relative luciferase units (RLU)) was measured in the cell lysates. The results are represented by mean values with S.D. from the triplicate wells. The representative data from three experiments are shown. C–E, HEK293T cells were transfected with TLR3 (C), TLR9 (D), and TLR4 (E) alone or with UNC93B1. A Western blot was performed using anti-TLR3 (C), anti-HA (D), or anti-Myc (E) antibodies. Anti-β-actin antibodies were used as a loading control. TLR3, TLR9, or TLR4 protein expression was normalized to the loading control and calculated as a percentage of the intensity of the proteins in cells not overexpressing UNC93B1. Densitometric analyses are shown below each blot. The representative data from three experiments are shown. F and G, HEK293T cells were transfected with TLR3 (F) or TLR9 (G) alone or with UNC93B1. 48 h post-transfection, the cells were incubated with cycloheximide for the indicated times. Cell lysates were prepared, and a Western blot was performed using anti-TLR3 (F) or anti-HA (G) antibodies. Anti-β-actin antibodies were used as a loading control. TLR3 and TLR9 protein expression was normalized to the loading control and calculated as a percentage of the intensity of the proteins in the untreated cells. Densitometric analyses and calculated half-lives of proteins are shown below each blot. The representative data from three experiments are shown.

