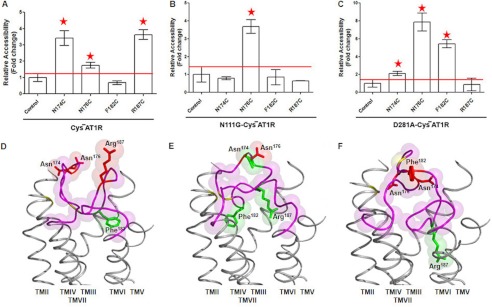
FIGURE 4.
MTSEA-biotin accessibility maps of ECL2 single-cysteine mutants in the empty states. The MTSEA-biotin relative accessibility of mutants are expressed as the means ± S.E., n = 3. The red line shown on the graph designates the significance cut off that determines the accessibility of mutants. Mutants with significantly higher accessibility compared with control are indicated with red asterisks. A–C, MTSEA-biotin accessibility maps of ECL2 mutants in HA-CYS−AT1R (A), N111G-CYS−AT1R (B), and D281A-CYS−AT1R (C) are shown in the absence of ligand. Note that the scales in A and B are different from that in C. D–F, the molecular dynamics of ECL2 frames that best fit accessibility data are shown in CYS−AT1R (D), N111G-CYS−AT1R (E), and D281A-CYS−AT1R (F). TM helices are shown in gray. The ECL2 backbone is shown in magenta. The side chains replaced by Cys reporter residues are shown in red when accessible and green when inaccessible. The disulfide-bonded cysteines Cys101 (TMIII) and Cys180 (ECL2) are shaded in yellow.

