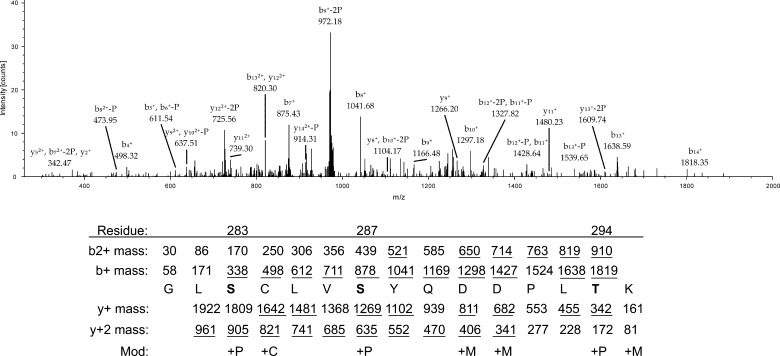
FIGURE 1.
MS/MS analysis of peptides corresponding to amino acids 281–295 of STAT2. S and T in boldface type indicate phosphorylated residues, and underlined mass indicates a match to a peak in the spectrum. P, phosphoryl group (79.97Da); C, carbamidomethyl (57.02 Da); M, methyl (14.02 Da). Not all peaks are annotated in the mass spectrum. Matches were made with a match tolerance of 3 Da.

