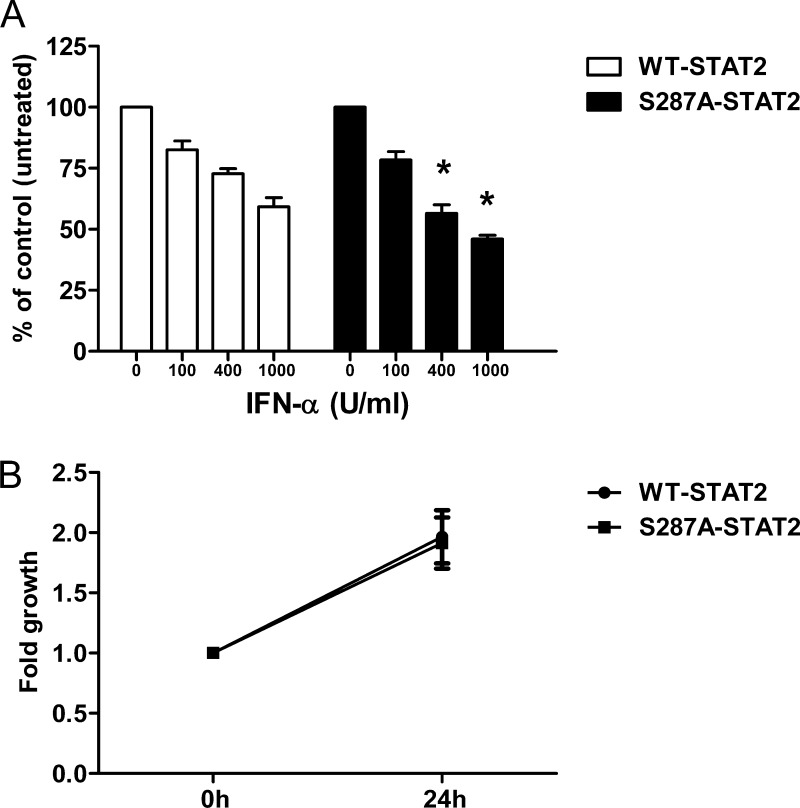
FIGURE 3.
S287A-STAT2 enhances the antiproliferative effects of IFN-α. A, U6A cells stably expressing WT-STAT2 or S287A-STAT2 were treated with IFN-α for 72 h or left untreated. Cell viability was measured by MTS assay. Results are presented as the percentage of viable cells treated with IFN-α compared with untreated cells (100%). Data were obtained from four individual experiments and are shown as mean ± S.E. An asterisk signifies a statistical difference (p < 0.05) compared with cells expressing WT-STAT2 and treated with the same concentration of IFN-α. B, growth rate was determined by MTS assay at two time points (referred to as 0 and 24 h in figure). Data presented are from five independent experiments and shown as mean ± S.E. U, units.

