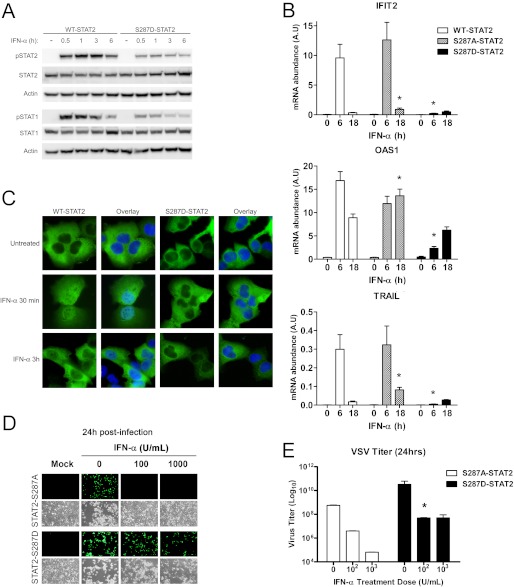
FIGURE 8.
Phosphomimetic S287D-STAT2 affects IFN-induced transcriptional and cellular responses. U6A cells stably expressing WT-STAT2, S287A-, or S287D-STAT2 were treated with IFN-α (1000 units/ml) for the indicated times. A, tyrosine phosphorylation of STAT2 (pSTAT2) and STAT1 (pSTAT1) was evaluated by immunoblot analysis. B, expression of ISGs was quantified by qRT-PCR and is shown as mRNA abundance. The bars represent the mean ± S.E.; n = 5; *, p < 0.05. C, cellular localization of STAT2 (green) by immunofluorescence staining. The nuclear stain DAPI (blue) was used in the overlay to discriminate between nucleus and cytoplasm. D, S287A-STAT2 and S287D-STAT2 cells untreated or pretreated with various concentrations of IFN-α for 16 h were infected with 0.01 multiplicity of infection GFP-expressing VSV. Mock controls are uninfected cells. E, viral titers from supernatants in D were determined and compared using Student's t test. Data presented are from two independent experiments and shown as mean ± S.E. *, p < 0.05.

