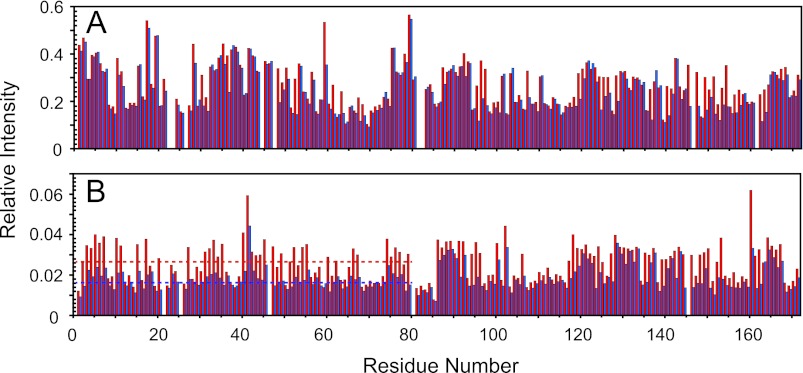
FIGURE 6.
H/D exchange of HGD and W42R mutant proteins. A, relative intensities of HGD resonances in 50% D2O to HGD resonances in 5% D2O at 0 h (red) and 30 h (blue). B, relative intensities of W42R resonances in 50% D2O to HGD resonances in 5% D2O at 0 h (red) and 30 h (blue). The average relative intensity of resonances in the 1H-15N HSQC spectra the N-td of W42R is indicated by the dotted line.

