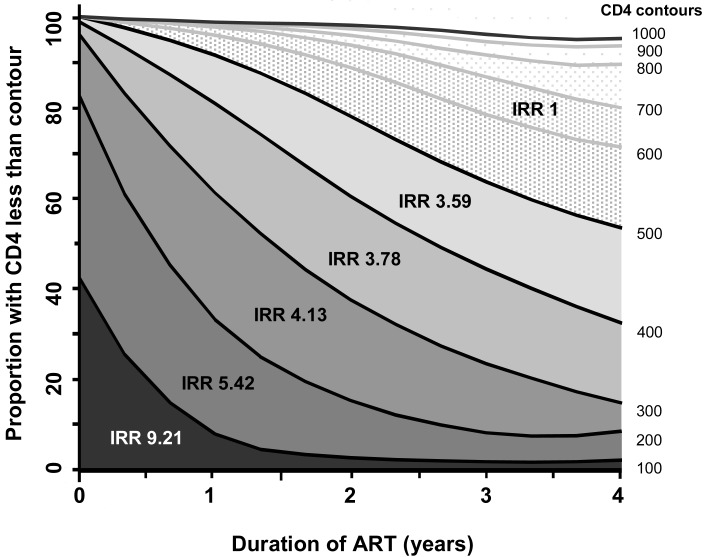
Fig. (5).
Changes in CD4 cell counts during 4 years of antiretroviral therapy. The graph shows the changes in proportions (%) of patients with CD4 cell counts below the threshold of 1000 cells/ mm3 stratified into 100 CD4 cell strata. The tuberculosis (TB) incidence risk ratios (IRR) are shown for each stratum with the comparator being the CD4 cell stratum greater than 500 cell/ mm3. The IRR are greatest in the lower CD4 cell strata. The proportions of patients with less than 300 cells/ mm3 decreased over 4 years. (Data from Lawn SD, Myer L, Edwards D, Bekker LG, Wood R. [57]).

