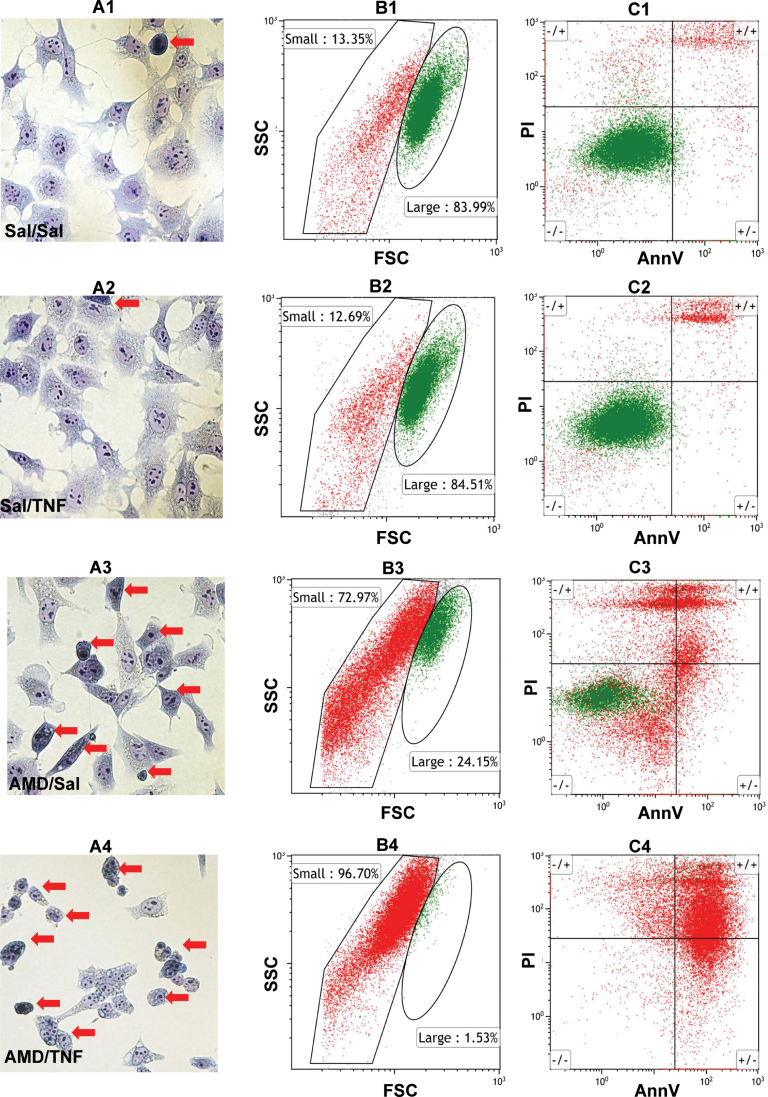
FIG. 4.
Morphological changes after AMD and/or TNF treatment.
Hepa1c1c7 cells were treated with 35µM AMD and/or 3ng/ml TNF for 48h. (A) Cells were stained by modified Wright’s method as described in Materials and Methods section. Images from light microscopy were collected. Red arrows denote cells with smaller size, round-shape (less stellate), a larger nucleus-to-cytoplasm ratio, darkly stained cytoplasm and less distinct nucleoli. (B) and (C) Cells were stained with AnnV/PI as described in Materials and Methods section. (B) Dot plots for FSC versus SSC. Gates distinguishing the small (RED) and large (GREEN) subgroups were drawn based on Sal/Sal treatment. (C) Dot plots for AnnV versus PI. Quadrant cutoffs were determined from Figure 2. GREEN and RED colors were derived from corresponding groups in plot B (Row1, Sal/Sal; Row2, Sal/TNF; Row3, AMD/Sal; Row4, AMD/TNF).

