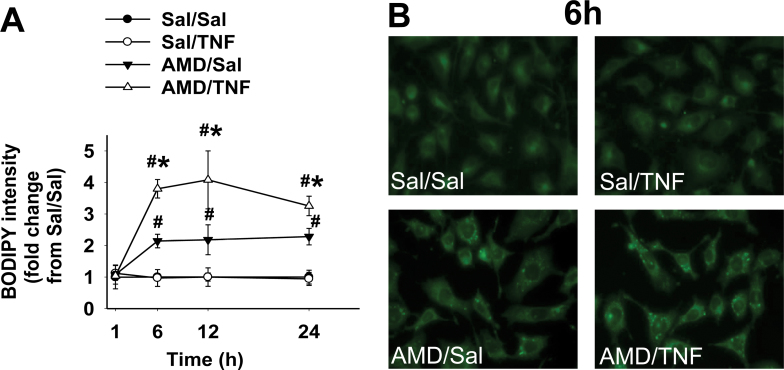
FIG. 9.
Lipid peroxidation in cells treated with AMD and/or TNF.
Hepa1c1c7 cells were exposed to 35µM AMD and/or 3ng/ml TNF for 1, 6, 12, or 24h and stained with C11-BODIPY581/591 as described in Materials and Methods section. The fluorescence from oxidized BODIPY was quantified as an indication of lipid peroxidation. (A) Fluorescence from oxidized BODIPY represented as fold changes from Sal/Sal group; (B) representative fluorescence photomicrographs for each treatment at 6h. Data within each time point were analyzed by two-way ANOVA. *Significantly different from the same treatment without TNF. #Significantly different from the same treatment without AMD. p < 0.05, n = 3.

