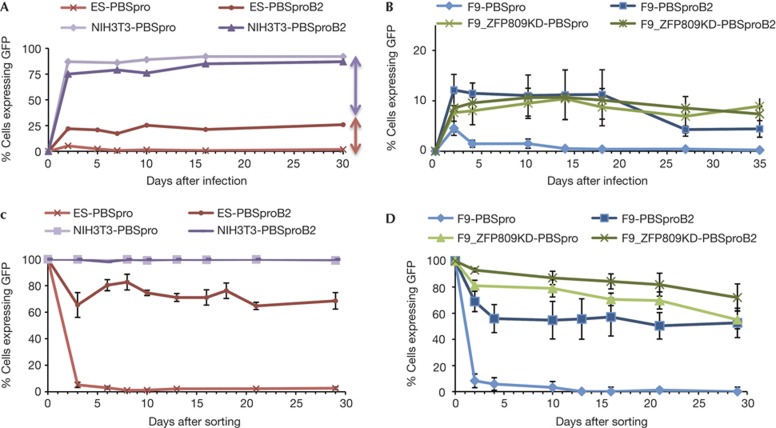
Figure 1.
Kinetics of silencing. Kinetics of viral silencing in ES cells using a GFP reporter virus. (A) Flow analysis of GFP-positive cells at different time points after infection (day 0) by wt (pro) and mutant (proB2) PBS virus in ES cells or differentiated cells. Representative experiment is shown (see Supplementary Fig S1A online for mean±s.d.). Arrows denote extent of silencing due to PBSpro-dependent (red) and PBSpro-independent mechanisms (purple). (B) Same assay on F9 scrambled pool and on ZFP809 KD F9 pool 9 ([7], see also Supplementary Fig S1C online). Note change of y axis from A. Averages±s.e.m. from three independent experiments are shown. For F9 EC cell line results see Supplementary Fig S1B online. (C) Flow analysis after FACS sorting of cells that escape restriction and express GFP. NIH/3T3 cells are shown as control. (D) Same analysis in F9 cells and F9 ZFP809 KD clone. Error bars show standard error of the mean (s.e.m.) for n=3 (C) or n=4 (D) biological replicates. See also Supplementary Fig S2 online for analyses of proviral DNA copy number and Supplementary Fig S3 online for ES-specific markers analysis. ES, embryonic stem; FACS, fluorescence-activated cell sorting; GFP, green fluorescent protein; PBSpro, proline tRNA primer-binding site; wt, wild-type.

