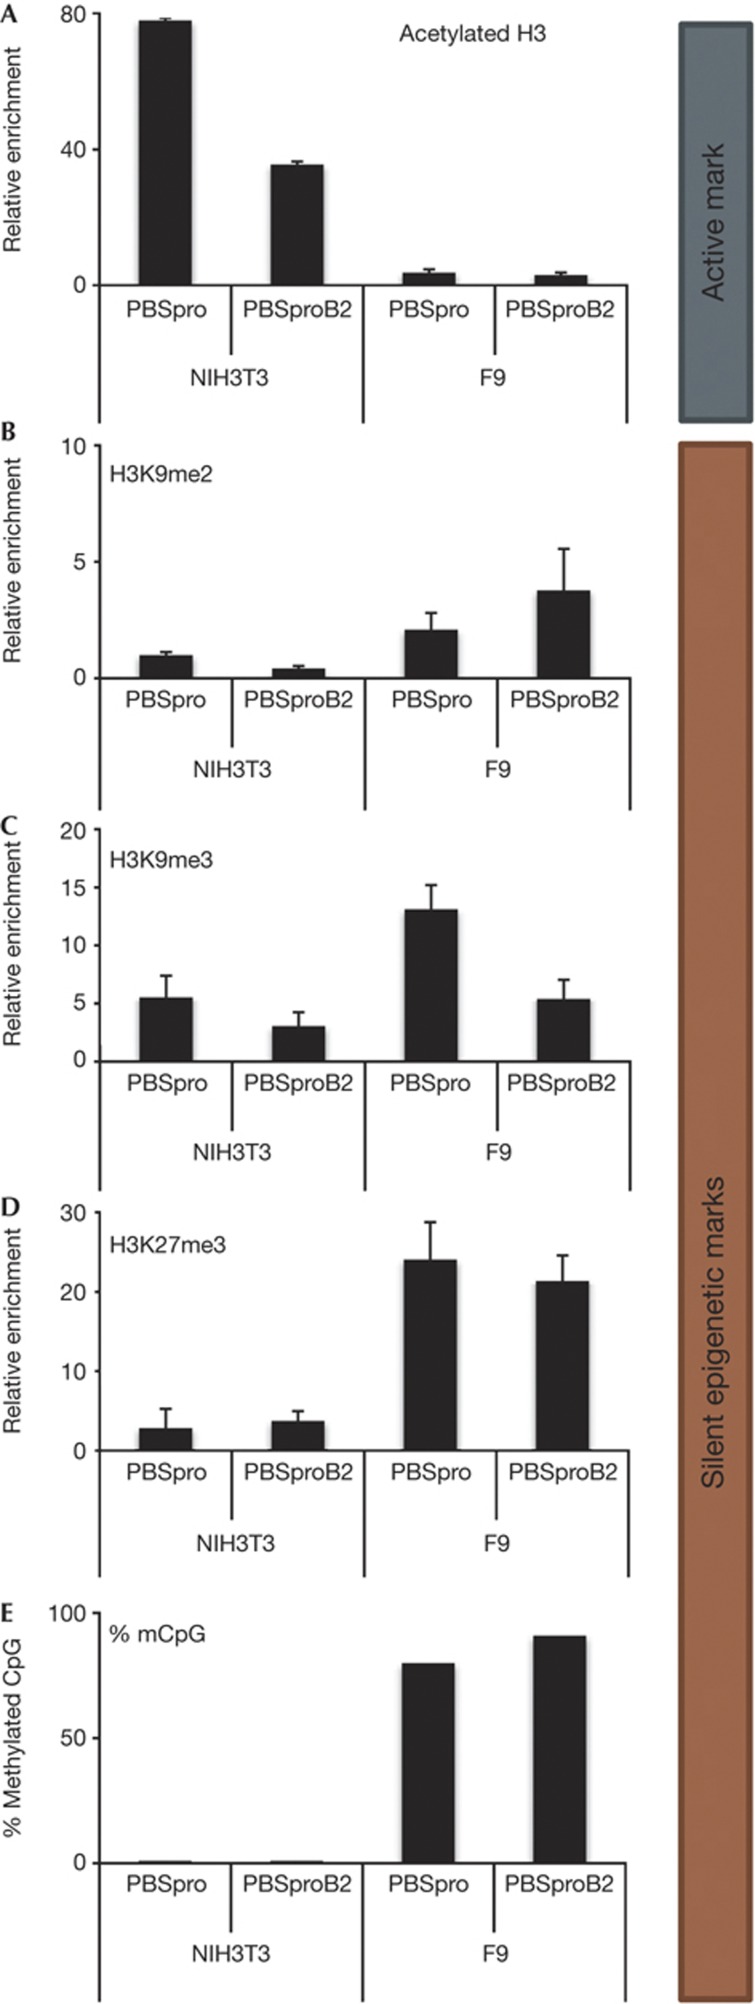
Figure 4.
Differences between 3T3 and F9 cells in chromatin marks and DNA methylation levels. ChIP-based measurement of (A) H3Ac, (B) H3K9me2, (C) H3K9me3 and (D) H3K27me3 at the viral PBS sequence of cells infected with GFP reporter virus with PBSpro or PBSproB2. As the two cell types gave different background binding, the signal was first normalized to IgG control ChIP, and normalized signal of negative control α-crystalline (H3Ac) or the Gapdh promoters (H3K9me2/3, H3K27me3) was set to 1. Averages±s.e.m. from three independent experiments are shown. Negative and positive control genes gave the expected enrichment values (not shown). (E) Bisulfite sequencing analysis of the 5′LTR of the infecting virus was performed on NIH/3T3 and F9 cells; Oct4 was used as control. Percentages of methylated CpGs are shown from 10 to 15 cloned DNA molecules per cell and infection type (Supplementary Fig S6 online). ChIP, chromatin immunoprecipitation; GFP, green fluorescent protein; 5′LTR, 5′ long terminal repeat; PBSpro, proline tRNA primer-binding site.

