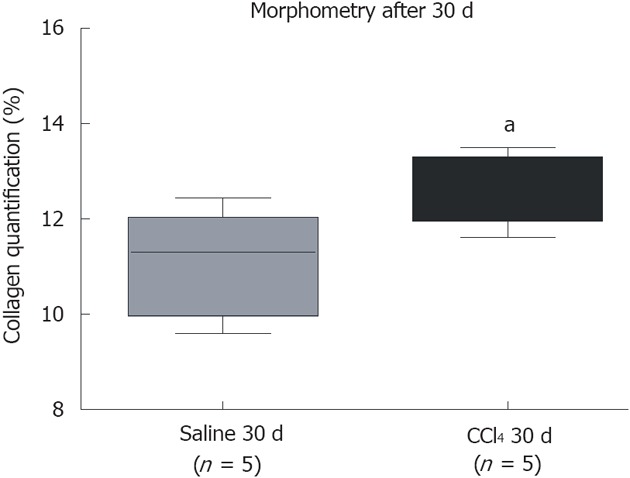
Figure 2.

Quantification of collagen by morphometric analysis. A significant increase in collagen between the group that received CCl4 compared to the group that received saline. The groups are represented by box–whisker diagrams in which the values in the boxes represent the medians of collagen content (n = 5) and the bars the 25%-75% range. The Mann-Whitney post-test was used to test for significance. aP = 0.0329 vs the Saline 30 d group.
