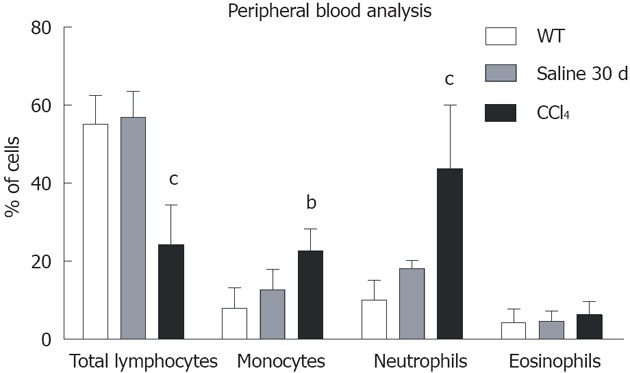
Figure 3.

Graphical analysis of subpopulations of peripheral blood of the WT, Saline 30 d and CCl4 30 d groups by flow cytometry. Only the animals in CCl4 30 d group showed significant differences from wild-type (WT): Total lymphocytes (WT = 55.2% ± 7.4%; Saline 30 d = 56.9% ± 6.6%; CCl4 30 d = 24.3% ± 10.2%); Monocytes (WT = 8.1% ± 5.3%; Saline 30 d = 12.7% ± 5.3%; CCl4 30 d = 22.7% ± 5.6%); Neutrophils (WT = 10.1% ± 5.0%; Saline 30 d = 18.2% ± 2.1%, CCl4 30 d = 43.8% ± 16.3%). One-way analysis of variance (ANOVA) followed by Dunnett’s test for multiple comparisons was used. bP < 0.01, cP < 0.001 vs WT.
