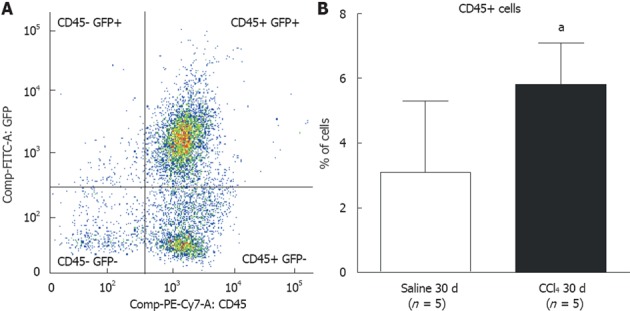
Figure 6.

Flow cytometric analysis of bone marrow subpopulations in the liver of chimeric mice. A: Dot-plot analysis of cell populations in the liver; B: A significantly greater population of CD45+ cells was observed in liver tissue of animals from the CCl4 30 d group compared to the Saline 30 d group (30 d saline = 3.1% ± 2.2%; CCl4 30 d = 5.8% ± 1.3%) (aP = 0.0458). GFP: green fluorescent protein.
