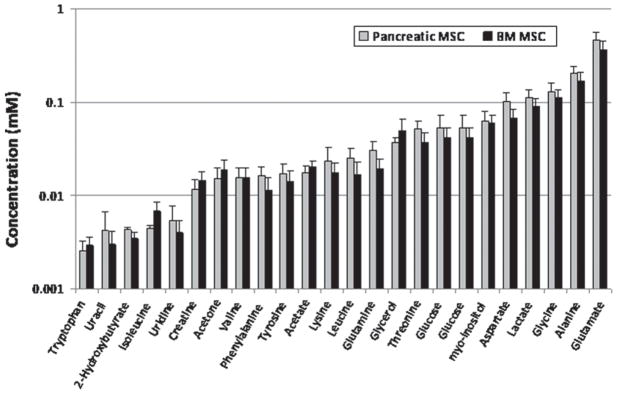
Figure 3.
Metabolomic profiles of pancreatic islet and BM MSC. The x-axis indicates metabolites and the y-axis shows concentrations of metabolites relative to the internal references (formate and DSS) at 0.1 mM. Standard error bars are shown for all metabolites as calculated using two-tailed t-tests.

