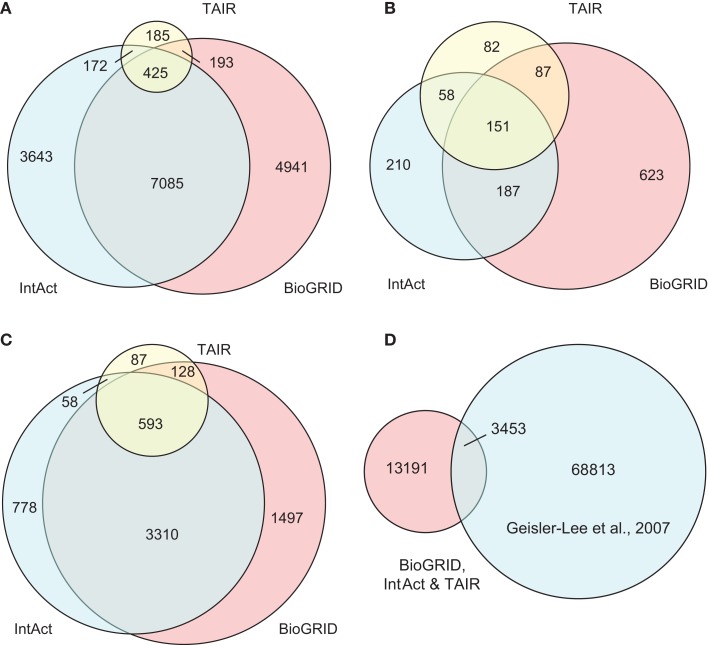
Figure 3.
Contributions of the three source DBs to the compiled data set (D1) in terms of: (A) binary interactions, (B) publication, and (C) interacting proteins. The largest contribution comes from BioGrid, although the overlap among the three is significant. (D) A small part of interaction predictions made by Geisler-Lee et al. (2007) were confirmed in PPI DBs, while the remaining form the complementary source of PPI data in our study. Venn diagrams showing correct proportions were drawn using Venn Diagram Plotter Pacific Northwest National Laboratory, http://omics.pnl.gov/software/VennDiagramPlotter.php

