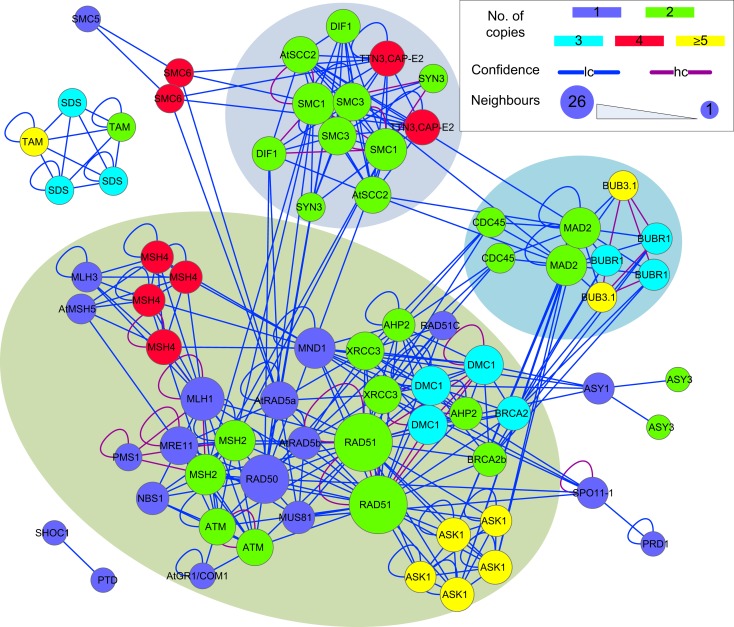
Figure 9.
A sub-network of the predicted interactome formed by putative B. rapa meiotic proteins. It is a densely connected network containing several hub proteins. B. rapa proteins are shown by their A. thaliana counterparts’ names; their unique accession numbers are not shown. Node color denotes the number of copies that a single A. thaliana gene/protein has in B. rapa. The confidence of interaction prediction is presented by edge colors. Node size is set to be proportional to the number of interacting partners of each individual protein. Figure generated using Cytoscape (Smoot et al., 2011).

