Figure 6.
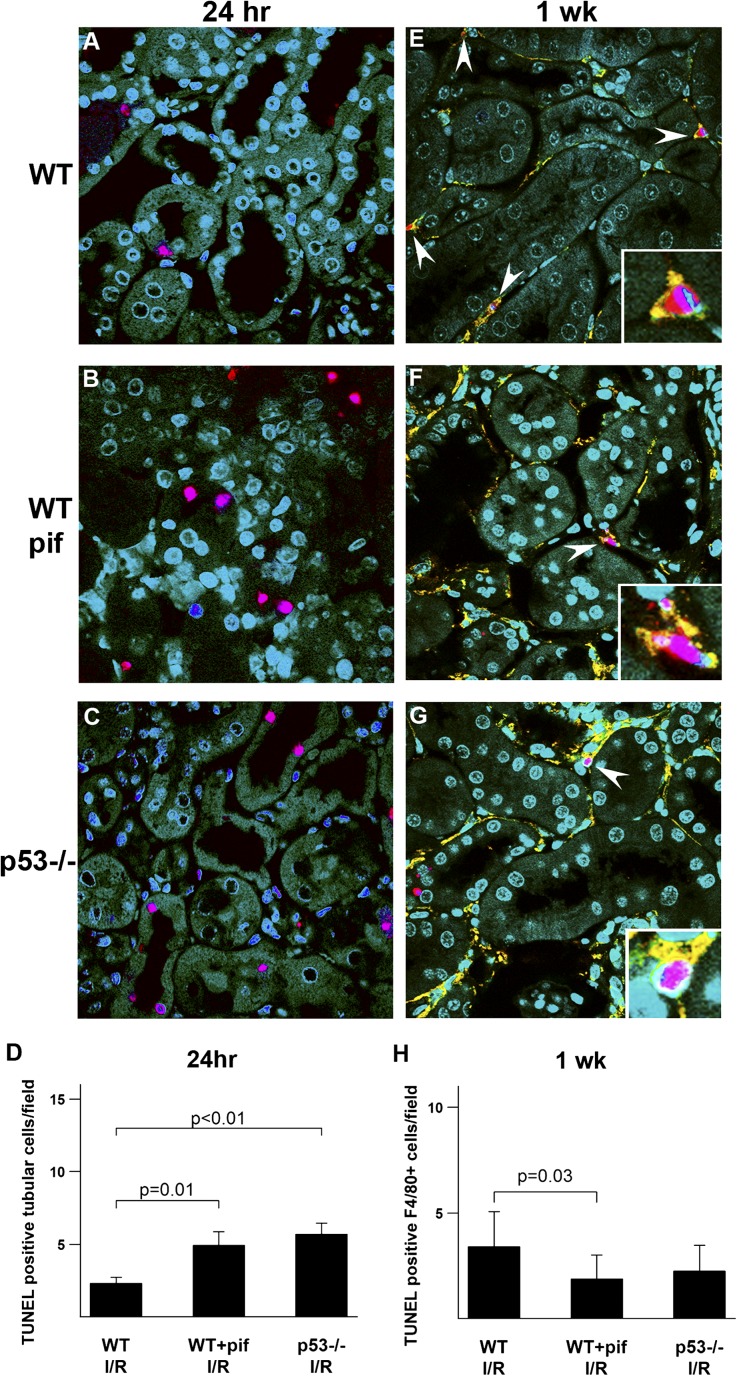
Effect of p53 absence or inhibition on tubular and inflammatory cell apoptosis after kidney IRI. Representative images of TUNEL staining (red) are shown for WT mice treated with vehicle control (A and E) or pifithrin-α (B and F), as well as p53−/− mice (C and G) after IRI at the indicated time points. At 1 week, the TUNEL is colabeled with anti-F4/80 antibody (yellow). DAPI (blue) is used as a counterstain, and green represents tubular autofluorescence. (A–C) Twenty-four hours after IRI, TUNEL staining localizes predominantly to tubular cells. (D) Quantitation of TUNEL-positive cells at 24 hours. (E–G) One week after IRI, TUNEL staining is readily detected in F4/80-positive cells (arrowheads). (H) Pifithrin-α–treated and p53−/− mice have a 2-fold to 3-fold increase in the number of infiltrating F4/80-positive cells and the TUNEL number per field is normalized to the number of infiltrating cells, thus yielding a TUNEL index that can be used to compare groups. n=4 per group per time point. DAPI, 4',6-diamidino-2-phenylindole; I/R, ischemia-reperfusion injury; pif, pifithrin-α.

