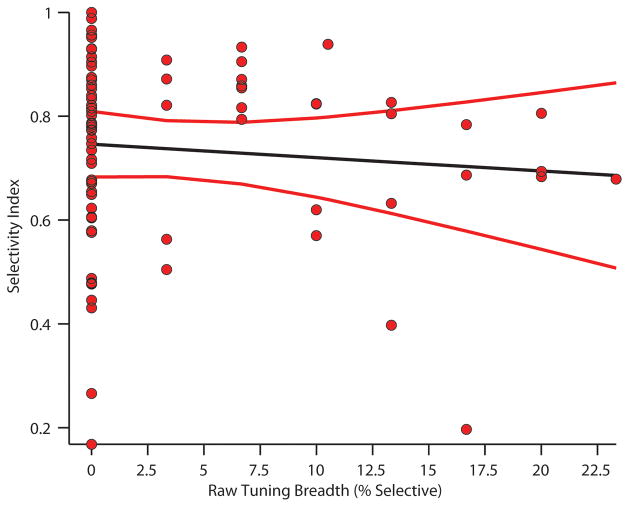
Figure 4. Comparison of Tuning measures.
Results of a linear regression comparing the results from different tuning breadth (or selectivity) measures. Raw tuning breadth (used in the current study) was estimated via Tukey post-hoc test, a measure effectively based on firing rate statistics across multiple image presentations, vs. the selectivity index, which is based on dispersion measures. The results of the regression indicate that there is no statistical relationship between the two measures, suggesting that the selectivity index does not adequately capture tuning properties of individual neurons. Red lines - standard errors of the regression.

