
Figure 2.
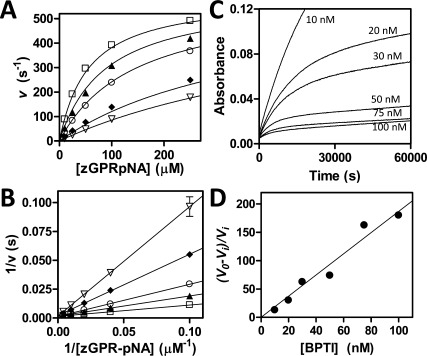
Inhibition of trypsin variants by BPTI and APPI. (A) Competitive inhibition of mesotrypsin-S39Y by APPI. Substrate concentration ranged from 10 to 250 μM and enzyme concentration was 0.25 nM; APPI concentrations were 0 (open squares), 7.5 nM (filled triangles), 20 nM (open circles), 75 nm (diamonds), and 120 nM (open triangles). Data were fit globally to the competitive inhibition equation as described in the Materials and Methods. (B) The Lineweaver-Burk double reciprocal transform displays convergence on the y-axis as is characteristic of the competitive model. (C) Slow, tight binding inhibition of cationic trypsin-Y39S by BPTI. A 16-h time course shows attainment of binding equilibrium by a series of parallel reactions with varying [BPTI] as indicated on the figure; substrate concentration was 150 μM and enzyme concentration was 0.1 nM. (D) Ki was determined from the slope of the replot of (v0 − vi)/vi versus [BPTI], where v0 is the uninhibited initial rate and vi corresponds to steady-state rates after attainment of enzyme-inhibitor binding equilibrium, as described in the Materials and Methods.