
Figure 3.
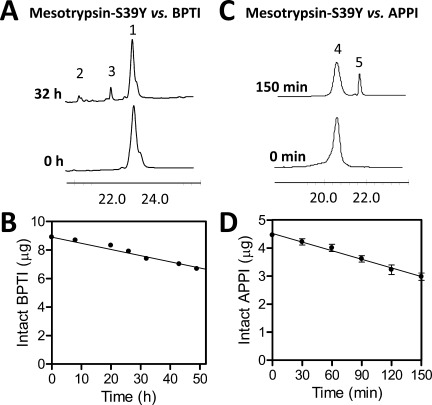
Hydrolysis of BPTI and APPI by mesotrypsin-S39Y. (A) HPLC chromatograms for samples taken at time zero and 32 h show resolution of intact BPTI (peak 1) from reduced cleavage products (peaks 2 and 3); the x-axis shows retention time in minutes and the y dimension represents absorbance at 210 nm. Reaction contained 60 μM BPTI and 2 μM mesotrypsin-S39Y. (B) Depletion of intact BPTI over time was quantified by peak integration, plotted versus reaction time, and fitted by linear regression to calculate hydrolysis rates. (C) HPLC traces from time zero and 4 h show resolution of intact APPI (peak 4) from nonreduced cleaved APPI* (peak 5). Reaction contained 25 μM APPI and 0.5 μM mesotrypsin-S39Y. (D) Depletion of intact APPI over time was quantified by peak integration, plotted vs. time, and fitted by linear regression to calculate hydrolysis rates.