
FIG. 4.
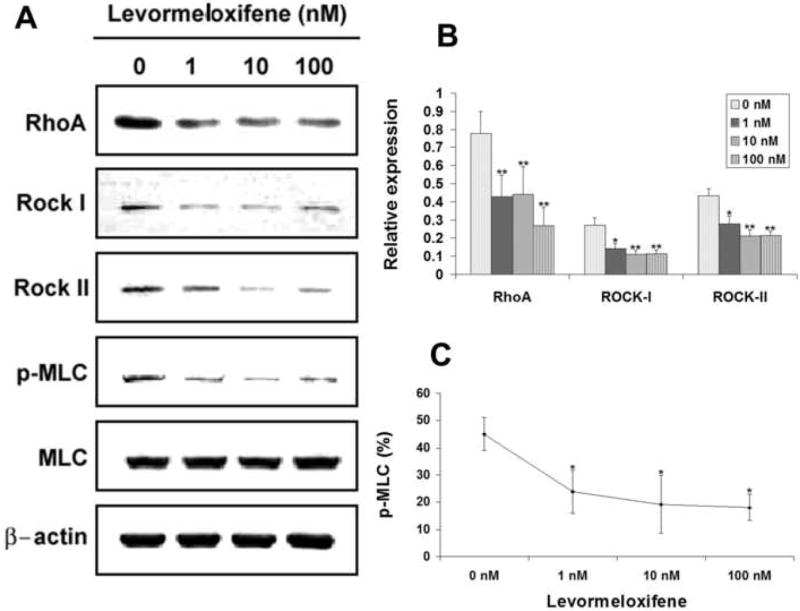
Effects of levormeloxifene on the expression of RhoA, Rock-I, Rock-II, MLC, and p-MLC. USMCs were treated with levormeloxifene at 0, 1, 10, and 100 nM and analyzed by western blotting for RhoA, Rock-I, Rock-II, MLC, and p-MLC. Three independent experiments were conducted for each drug. One representative graph of the three experiments is shown in panel A for each drug. The expression levels of RhoA, Rock-I, and Rock-II are displayed as relative expression against β-Actin expression (panel B). MLC phosphorylation level is the ratio (in percentage) between p-MLC and MLC expression levels (panel C). Asterisks denote significant difference in comparison with control (0 nM). *, P<0.05; **, P<0.01.