
Fig. 5.
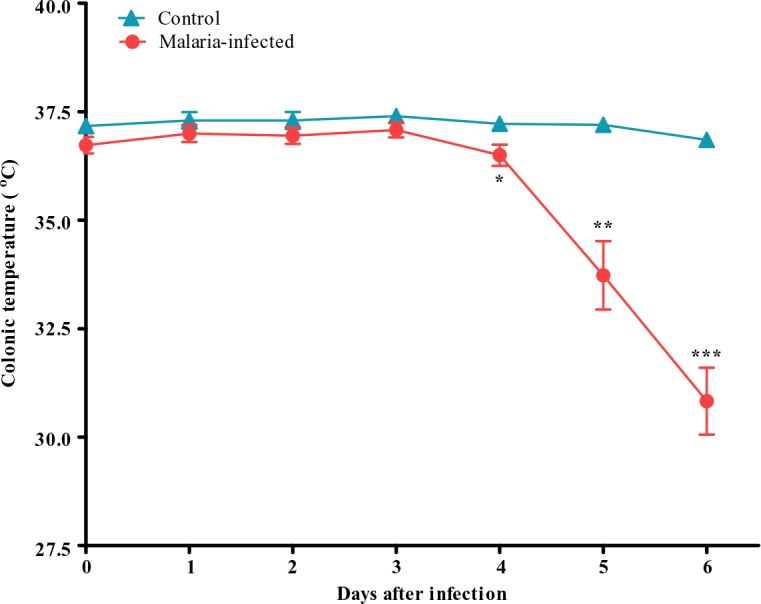
Colonic temperature of control and malaria-infected mice. Results are presented as the mean ± s.e.m of N = 8, *P<0.05, **P<0.005, ***P<0.0005
Official websites use .gov
A
.gov website belongs to an official
government organization in the United States.
Secure .gov websites use HTTPS
A lock (
) or https:// means you've safely
connected to the .gov website. Share sensitive
information only on official, secure websites.
Colonic temperature of control and malaria-infected mice. Results are presented as the mean ± s.e.m of N = 8, *P<0.05, **P<0.005, ***P<0.0005