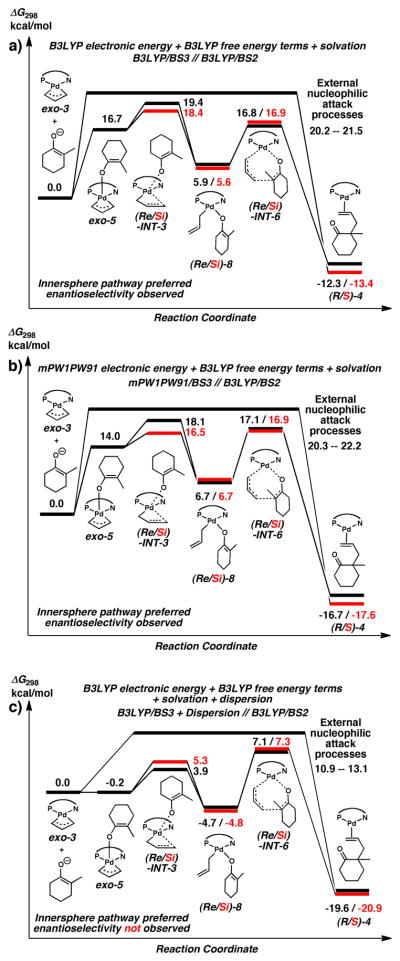
Figure 10.
Mechanistic pathways summarizing three different calculation schemes used in this study. Numbers depict relative free energies (in kcal/mol) for relevant intermediates and transition states in the reaction mechanism. a) shows energies calculated from B3LYP/BS3//B3LYP/BS2 including single-point solvation corrections. b) shows the same energies as a) except with mPW1PW91/BS3 single-point electronic energies. c) shows the same energies as a) except including single-point dispersion energy corrections. See text for discussion.

