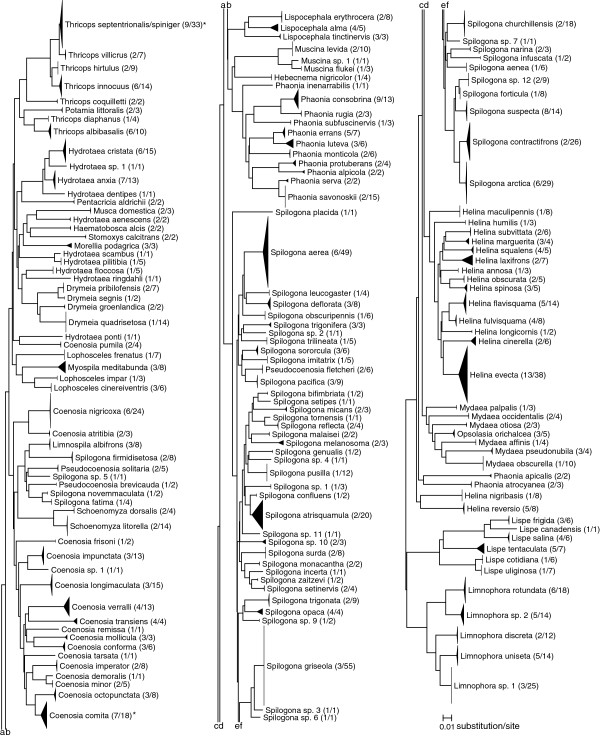
Figure 2.
Neighbour-joining tree of post-reassessment data set. Kimura 2-parameter NJ tree representing 1114 COI sequences from 160 Muscidae species. For each taxon terminal, height of the triangle represents the number of specimens and width represents the extent of intraspecific divergence. Species with bootstrap values below 95% indicated with an asterisk. Numbers in parentheses represent the number of haplotypes and the number of sequences for each taxon.

