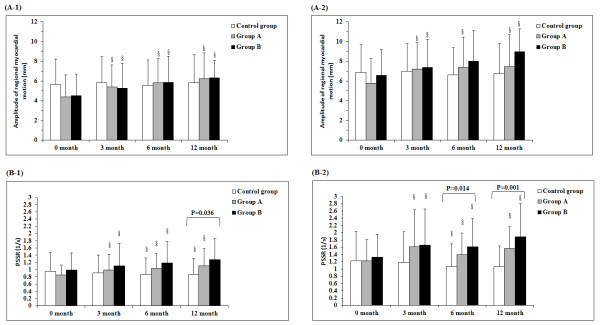
Figure 2 .
Comparison of amplitude of regional myocardial motion at baseline (A-1) and after dobutamine loading (A-2), and PSSR score at baseline (B-1) and after dobutamine loading (B-2). Data were presented as mean ± standard deviation as described in the statistical analysis methods. Twelve patients in group B had a missing record PSSR at baseline in 12 months. *P < 0.05, indicated significant difference was identified among control group, group A, and group B. §P < 0.05, indicated there was significant difference as comparing with time = 0 months for a given baseline or after load conditions in the corresponding group.

