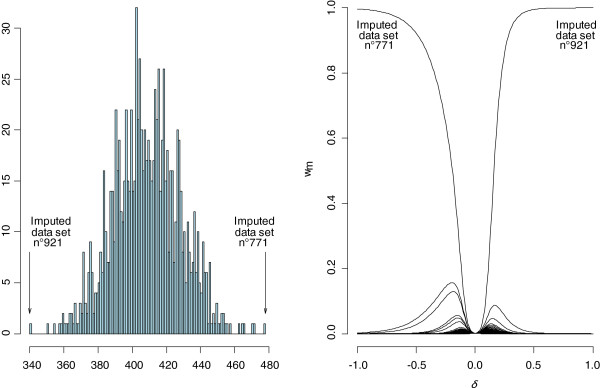
Figure 1.
Graphical determination of a delta value for the variable genotype 3. Left panel: histogram of the sum of genotype 3 imputed values for each data set and for M = 1000 bases ; extreme values of this sum are 340 in imputed dataset n°921 and 480 in imputed dataset n°771. Right panel: normalized weights (wm) for each imputed dataset according to δ.

