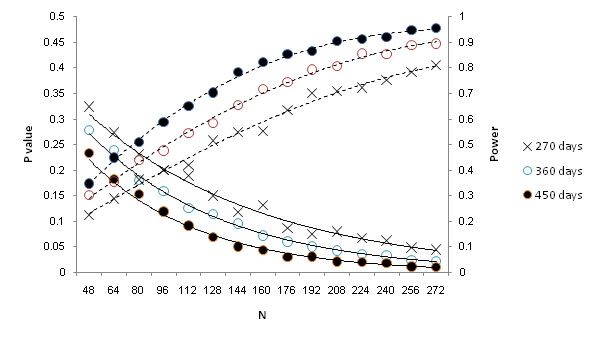
Figure 5.

Power curves (dashed lines) and related significance (solid lines) assuming a hazard ratio of 0.9 reduction in the premises-specific violence hazard ratio.

Power curves (dashed lines) and related significance (solid lines) assuming a hazard ratio of 0.9 reduction in the premises-specific violence hazard ratio.