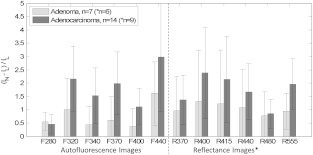
Fig. 3.
Lesion contrast results for adenomas () and adenocarcinomas () in various image types. (Reflectance images were available only for the final six adenomas and nine adenocarcinomas.) This plot specifies the mean Weber contrasts and standard deviations for each image type. Because in these images, lesion and normal intensities were interchanged in Eq. (1). Image F440 displayed the most lesion contrast for both adenomas and adenocarcinomas, but its performance was statistically similar to several other image types.

