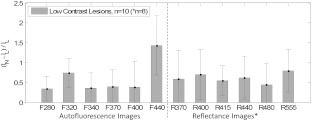
Fig. 4.
Lesion contrast results for the low contrast lesion specimen subgroup whose members were all difficult to visualize in RGB color photographs taken with a standard digital camera. This group included adenomas () and adenocarcinomas (). (Reflectance images were available only for the final five adenomas and three adenocarcinomas.) This plot specifies the mean Weber contrasts and standard deviations for each image type. Because in these images, lesion and normal intensities were interchanged in Eq. (1). Image F440 displays greatest contrast, and the increase is statistically significant (-test, ) compared to all of the other image types.

