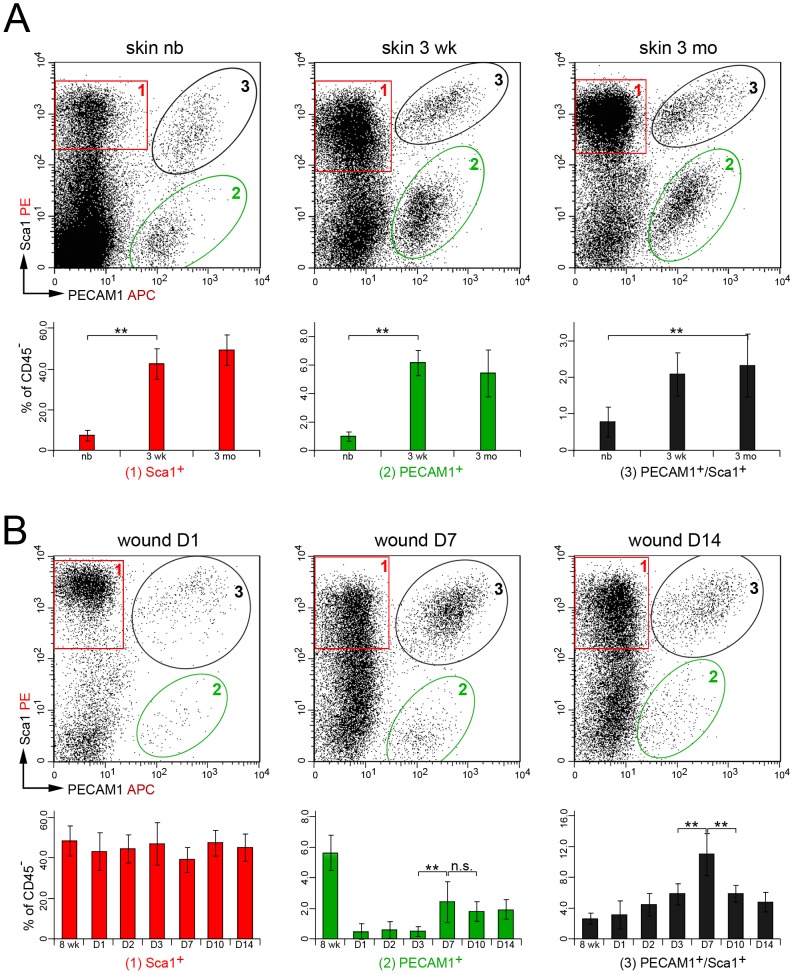
Figure 2. Distribution of PECAM1 and Sca1 protein on skin- and wound-derived cells.
(A) Flow cytometry analysis of Sca1 and PECAM1 expression in CD45- non-hematopoietic cells isolated from newborn (nb), three weeks (3 wk) and three months (3 mo) old dermis. Sca1+ (1, red box), PECAM1+ (2, green ellipse) and PECAM1+/Sca1+ (3, black ellipse) cell populations are highlighted. (B) Dot plots of Sca1 and PECAM1 expression in cell suspensions isolated from full thickness wounds one (D1), seven (D7) and 14 days (D14) post injury of eight weeks old mice. Percentage of positive cell populations at the different time points of flow cytometry analysis (lower panel) is given with standard deviation and significant changes were determined using the unpaired two-tailed student’s T-test (n≥3, **p≤0.01, n.s = not significant).

