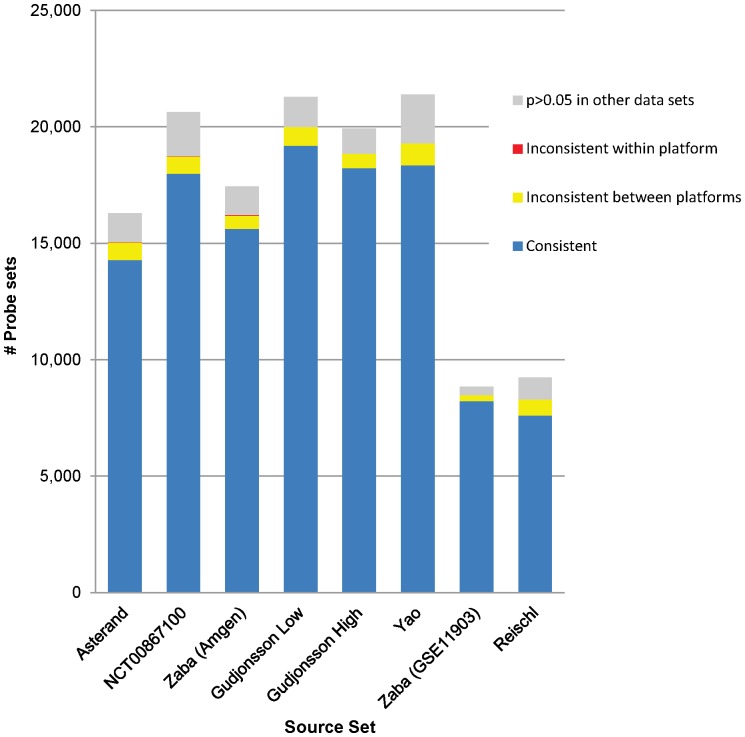
Figure 1. Comparison of Differential Expression Across Data Sets.
For each data set a list of probe sets with differential expression at p≤0.05 was generated and compared to all the other data sets. The probe sets were then categorized into four different groups according to the extent of agreement between the source data set and the other data sets: i) “consistent” meant that there was at least one other data set in which the probe set showed differential expression in the same direction with p≤0.05 and no data sets with differential expression in the opposite direction with p≤0.05; ii) “inconsistent between platforms” indicated that there was at least one data set from the other platform with differential expression at p≤0.05 in the opposite direction; iii) the “inconsistent within platform” group contained probe sets with differential expression at p≤0.05 in different directions within the same platform; and iv) the “p>0.05 in all other” group contained probe sets where the source set was the only one with significant differential expression. The number of probe sets with differential expression in the Zaba (GSE11903) and the Reischl sets were smaller because samples were run on U133A arrays, which contain only 22,215 probe sets.

