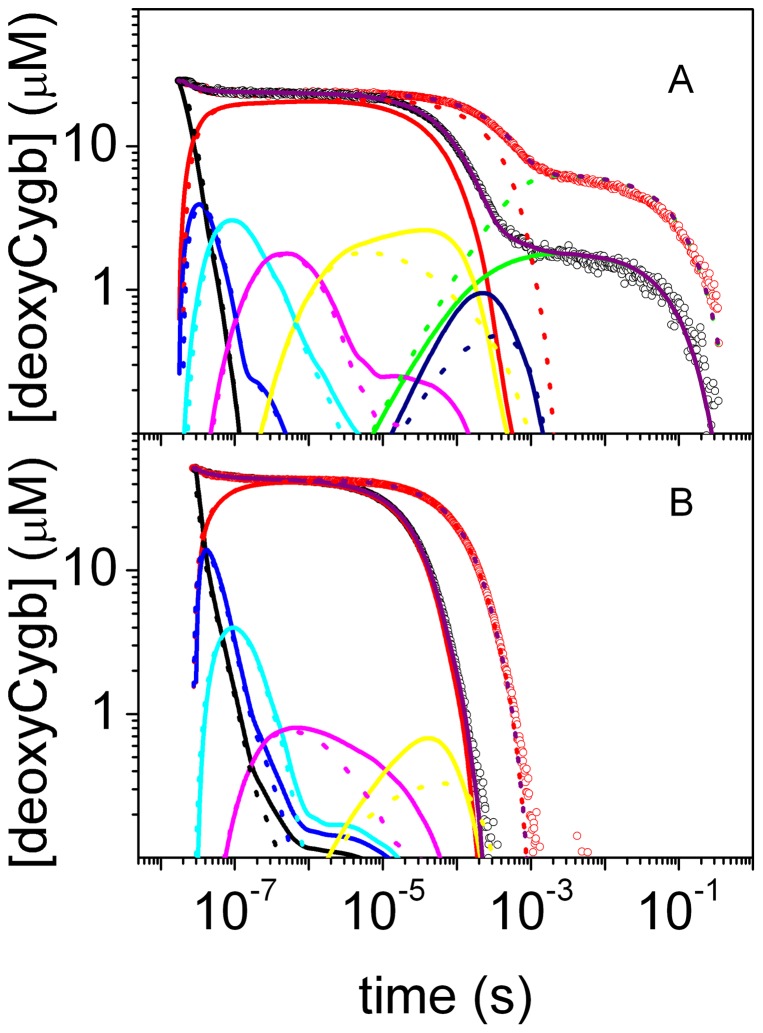
Figure 3. Kinetic analysis of CO rebinding.
Analysis of the CO rebinding kinetics to wt Cygb (A) and HE7Q Cygb* mutant (B) solutions equilibrated with 1 atm CO (black circles) and 0.1 atm CO (red circles). T = 40°C. The fits (purple lines) are superimposed to the experimental data (circles). In the figures we have also reported the time course of the other relevant species in the scheme in Figure 2 at 1 atm CO (solid lines) and 0.1 atm (dotted lines): (Cygbp:CO)1 (black), (Cygbp:CO)2 (blue), (Cygbp:CO)3 (cyan), (Cygbp:CO)4 (magenta), (Cygbp:CO)5 (yellow), (Cygbh:CO)6 (dark blue), Cygbh (green), Cygbp (red).

