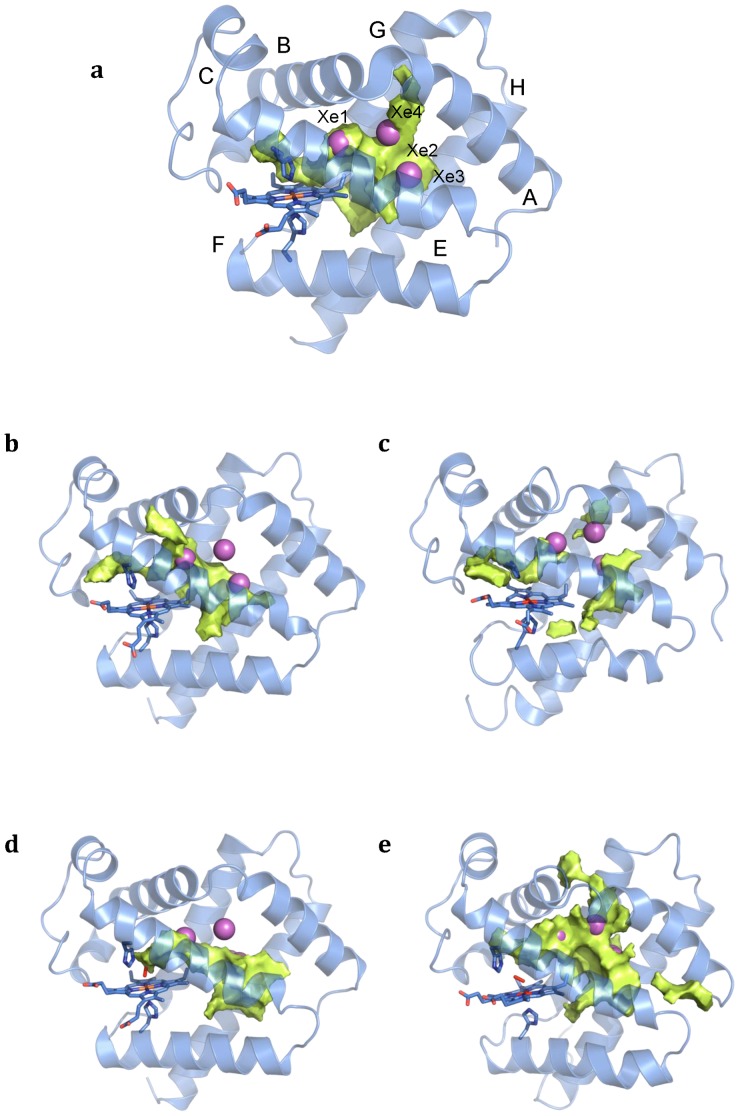
Figure 7. Representation of the average cavities found by MDPOCKET calculations.
a. Cygbh; b. Cygbp from HE7Q mutant; c. Cygbp from X-ray 3AG0; d. O2Cygb from HE7Q mutant; e. O2Cygb from X-ray 3AG0. The cavities and tunnels detected for the distinct coordination states of the protein are shown in pale yellow. The Xe binding sites found in the X-ray crystallographic structure are numbered and represented as spheres (magenta).

