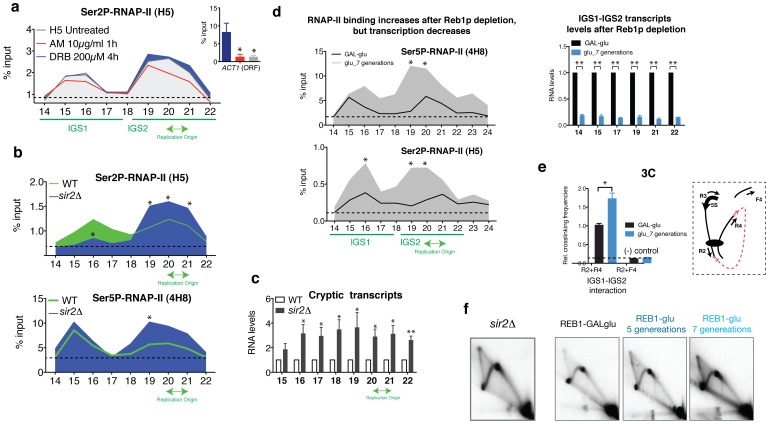
Figure 6. The levels of RNAP-II bound to the chromatin affects DNA replication at the rDNA locus.
(a) ChIP analysis shows the binding of Ser2P-CTD to the rDNA before and after treatment with AM and DRB. Values are expressed as the mean±S.E.M. n = 2. (b) ChIP analysis of Ser2P-CTD (H5) and Ser5P-CTD (4H8) using a wild type strain and sir2Δ within rDNA IGS regions. Mean ± S.E.M. n = 3. *p<0.05 for Student’s t-test, wild type versus sir2Δ. (c) rtPCR-based analysis of transcripts within IGS regions in wild-type and sir2Δ. Mean ± S.E.M. n = 3. **p<0.005, *p<0.05 for Student’s t-test, wild type versus sir2Δ. (d) ChIP analysis of RNAP-II (4H8 and H5) binding in a GAL-REB1 strain. The cells were grown in a 2% galactose/0.3% glucose medium (+REB1) and shifted to 2% glucose to repress REB1 expression (REB1-). An RT-PCR-based analysis of the IGS transcripts is shown on the right. Mean ± S.E.M. n = 2 o n = 3. **p<0.005, *p<0.05 for Student’s t-test, REB+ versus REB- (7 generations). (e) 3C analysis in a GAL-REB1 strain. Controls for random ligation (R2+F4; [38]) are shown. Mean ± S.E.M. n = 3. *p<0.05 for Student’s t-test, REB1+ versus REB1-. (f) 2D gels of RIs corresponding to sir2Δ and GAL-REB1 strain grown in a 2% galactose/0.3% glucose medium (REB1+) or in 2% glucose for 5 or 7 generations (REB-).

