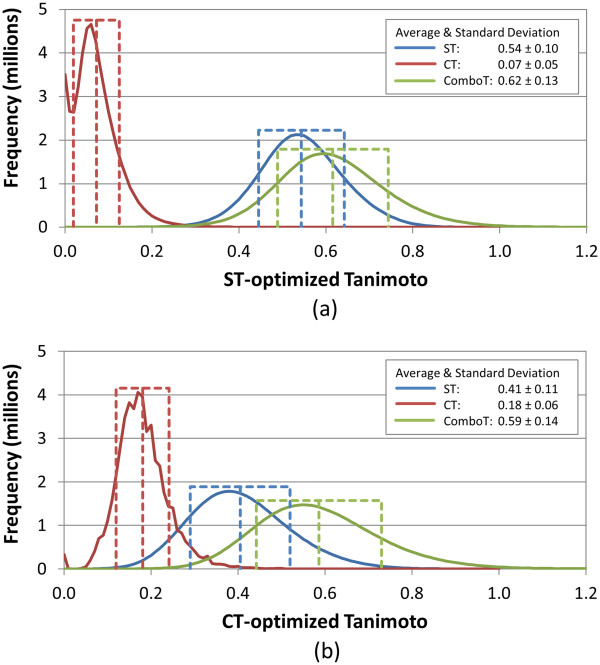
Figure 1.
Similarity distributions for “single-conformer” (Scenario A) approach. Binned distributions in 0.01 increments of the 3-D similarity scores for the unique “conformer-conformer” pairs arising from 10,000 randomly selected biologically tested compounds (10-K set), computed using a single conformer per compound for (a) ST-optimized and (b) CT-optimized superpositions.

